So, have hot years become the norm?
Data storytelling on how maximum temperatures have changed in Montbéliard and the Bourgogne-Franche-Comté region since 1959, based on Météo-France open data.
- Web development
Context
Professional simulation project of the BUT MMI degree (SAÉ 303), “Climate change” challenge of the Open Data University. The question: have hot years become the norm in Montbéliard? Is this warming local or regional, and does it affect every season the same way?
My role
In a pair with Ruslana Budniak: storytelling and visualisation design, Astro website development, deployment (Netlify, domain on Infomaniak) and publication of the reuse on data.gouv.fr.
- Context
- Professional simulation project (SAÉ)
- Team
- Pair
- Period
- October 2026
Goals
- Use reliable public data (Météo-France homogenised series)
- Tell a clear story in 4 parts and 5 visualisations
- Publish an accessible website and a reuse on data.gouv.fr
Outcome
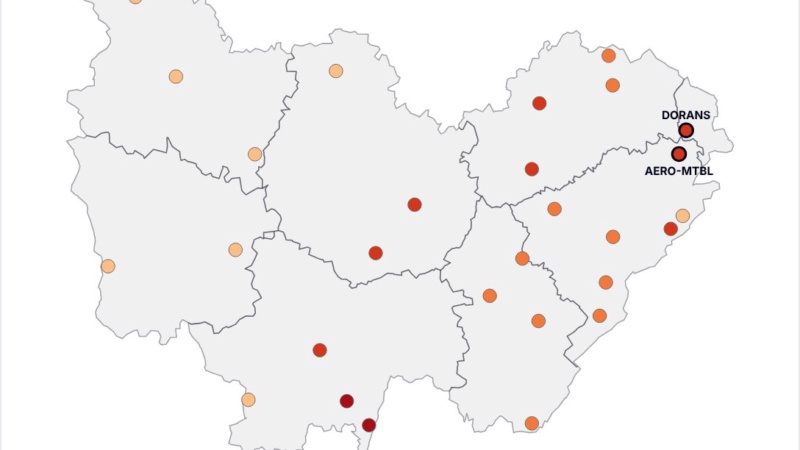
A live website, an Observable notebook, a public GitHub repository and a reuse published on data.gouv.fr (the French government open data portal), “Évolution des températures maximales à Montbéliard et en Bourgogne-Franche-Comté depuis 1959”. Key message: all 28 weather stations in the region have warmed (+1.19 to +1.58 °C), and summer and spring are warming about three times faster than autumn.
<under-the-hood />
Under the hood
Front-end
-
 Astro
-
 Tailwind CSS
- TypeScript
- Observable Plot
Deployment & management
-
 Git & GitHub
-
 Netlify
Technical choices
- Charts drawn at build time and delivered as SVG with no JavaScript, for performance; only the interactive chart is drawn in the browser
- Parameterised functions: each visualisation receives its data, and titles are computed from the data (no hand-typed figures)
- Accessibility: figure/figcaption, aria-label, keyboard-accessible tooltips, light and dark themes
- Problem solved: the gradient legend crashed on the server (JSDOM has no canvas); replaced with a clearer 4-class legend
Challenges and solutions
-
bug #1
The gradient legend crashed the site build
Cause: Charts are drawn on the server with JSDOM, which has no canvas
✓ fix Solution: Replace the gradient with a clearer 4-class legend
-
bug #2
Making the charts understandable without sight
Cause: An SVG chart on its own isn’t read by screen readers
✓ fix Solution: Figure elements, aria-label descriptions and keyboard-accessible tooltips
Full process
-
Step 1: Finding the data
Search for reliable public climate datasets: Météo-France homogenised series (monthly temperatures and rainfall since 1959).
-
Step 2: Analysis and cleaning
Data analysis, then cleaning: selecting reliable stations, periods and measurements, to compare like with like.
-
Step 3: Exploration and charts in Observable
Data loaded into an Observable notebook to explore it, test hypotheses and build the charts with Observable Plot.
-
Step 4: Building the website
An Astro website presenting the context, the method and the results: the charts and the map of the region’s 28 stations.
-
Step 5: Going live
Deployed on Netlify, on my own domain name (maman-sambe.fr).
-
Step 6: Publication on data.gouv.fr
The site was published as an official reuse of the data on data.gouv.fr, the French government open data portal: “Évolution des températures maximales à Montbéliard et en Bourgogne-Franche-Comté depuis 1959”, under our organisation “SAÉ 303 — Groupe 5”, set up with my partner, Ruslana Budniak.
What I learned
Data doesn’t speak for itself: you have to choose a message, then build each chart to serve it.
I also got into the habit of computing every figure from the data instead of typing it by hand: the site stays correct if the data changes.
Project preview

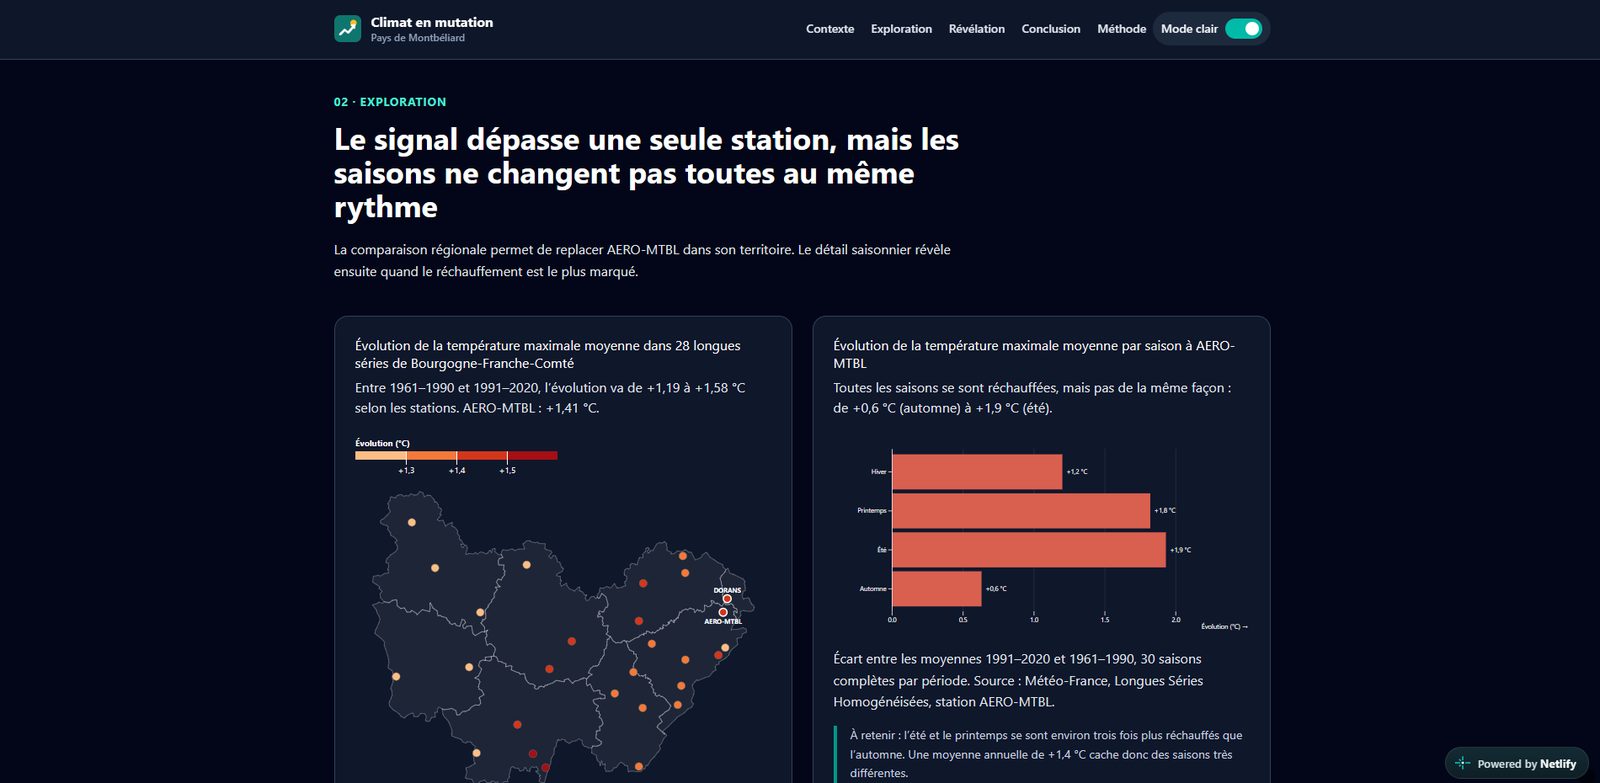

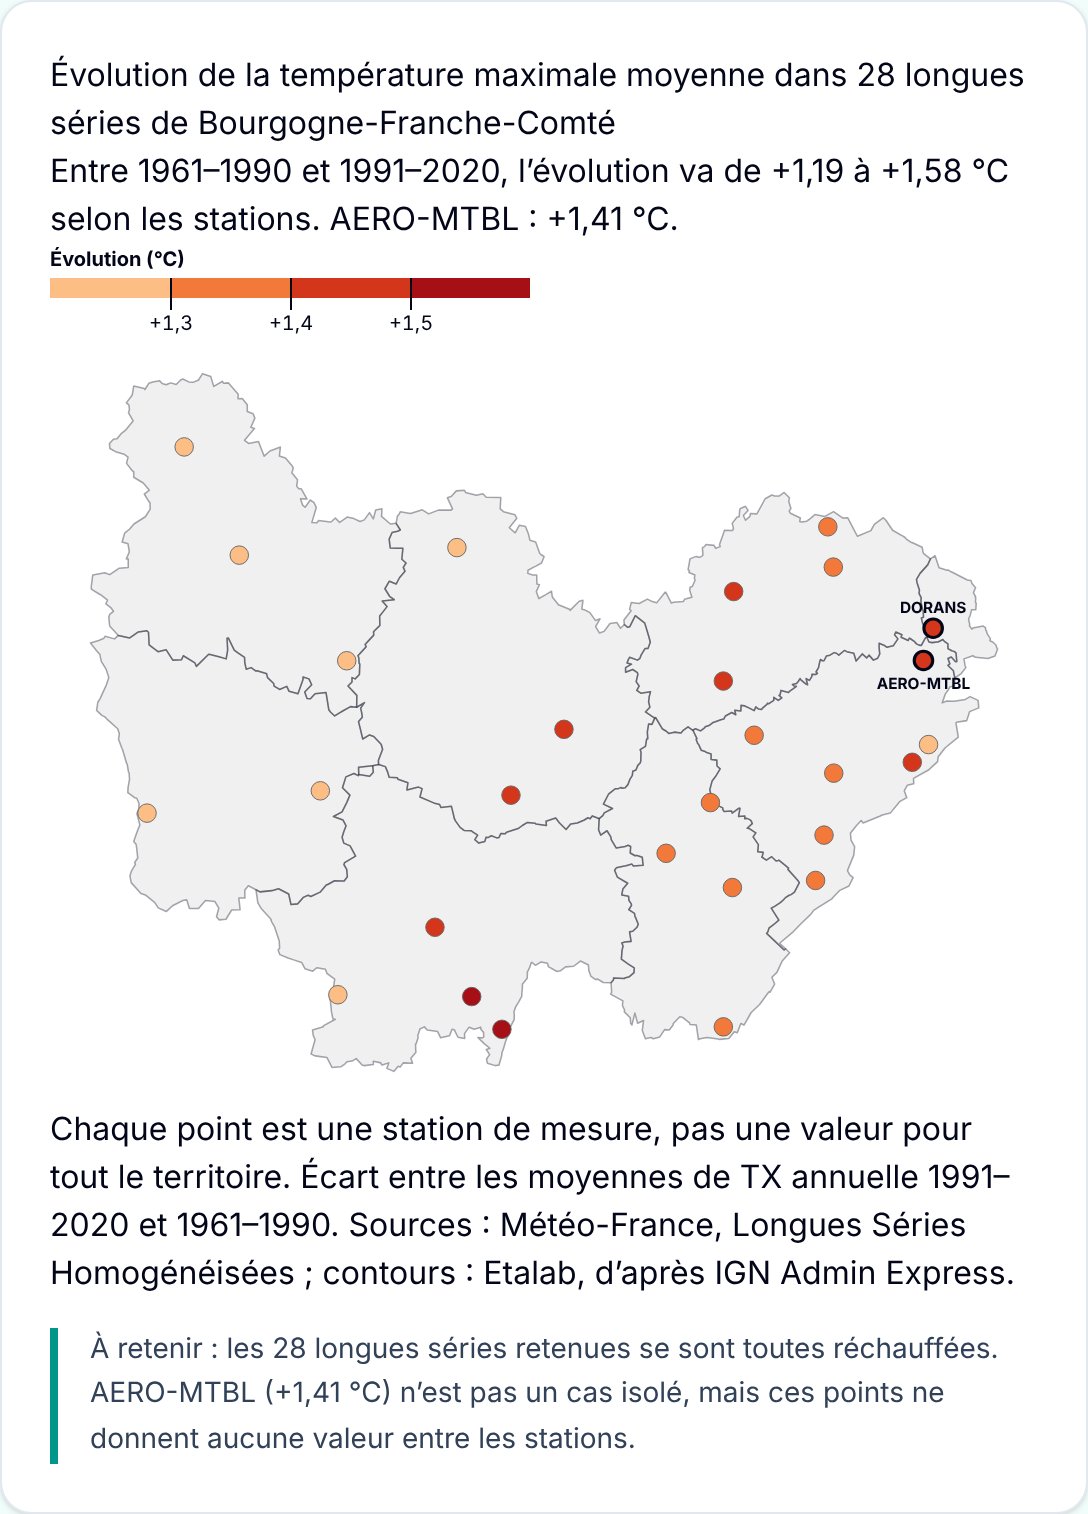
The site runs live on all three devices. Click a device to browse inside it.
Open the site in a new tab ↗